
Report Builder and saved reports
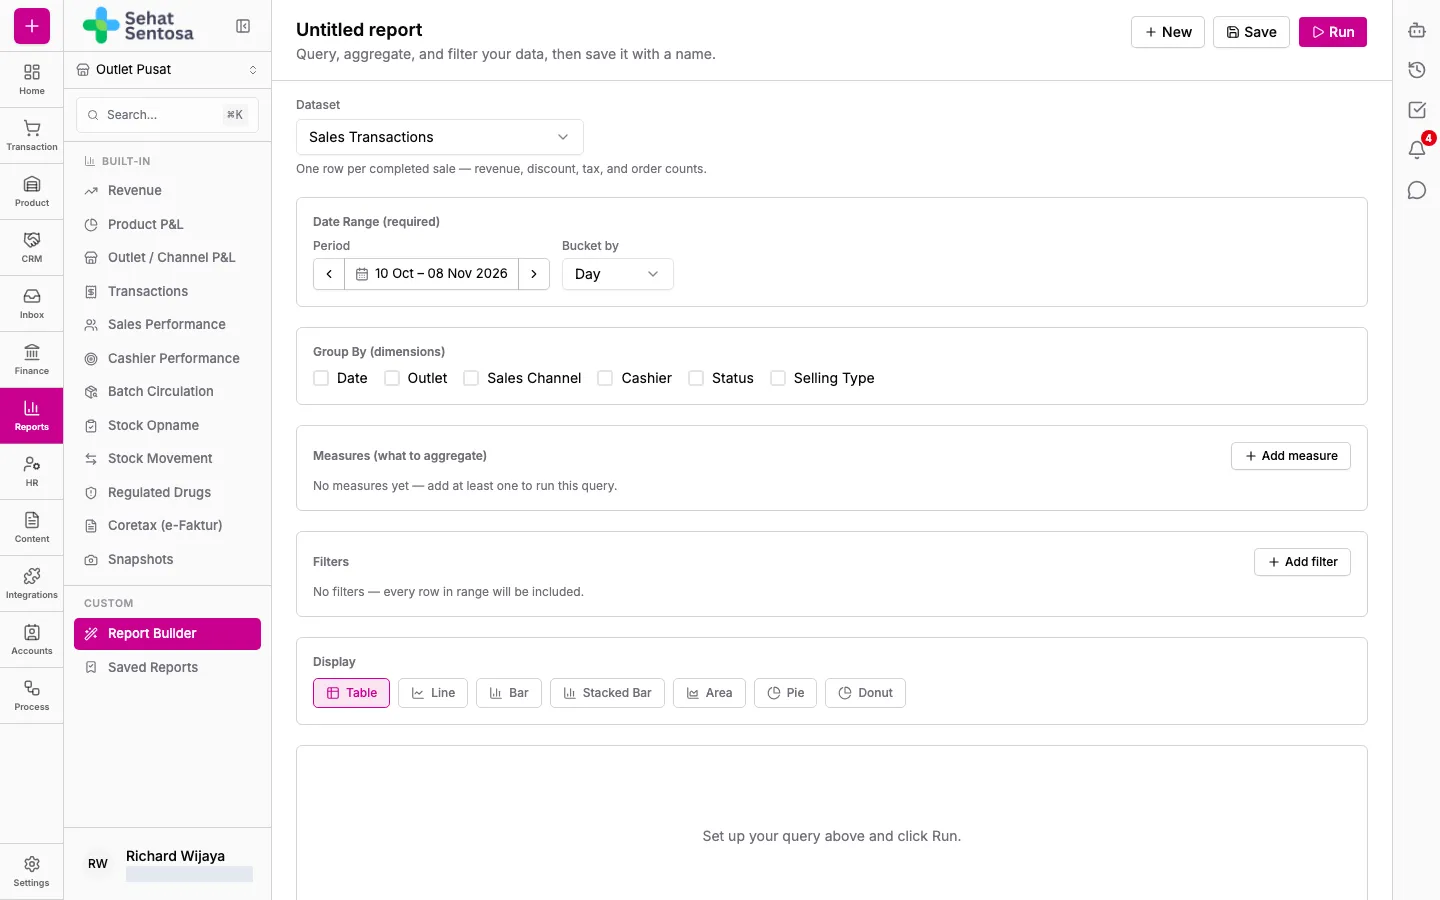
When the built-in reports don’t answer your question, use Report Builder to put together your own query, such as “weekly revenue by outlet”. Queries can be saved and run again at any time.
Build a report
Section titled “Build a report”- Go to Reports → Custom → Report Builder.
- Under Dataset, choose the data source:
- Sales Transactions: POS sales transactions.
- Sales by Product: sales per product.
- Stock Movements: stock movements.
- Fill in Date Range (required), then choose Bucket by (Day, Week or Month).
- Under Group By (dimensions), choose how to group the data, for example by outlet, sales channel, cashier or product.
- Under Measures (what to aggregate), click Add measure and choose what to calculate, such as total revenue or the number of orders. At least one measure is required.
- Add Filters if you need to narrow the data.
- Under Display, choose Table, Line, Bar, Stacked Bar, Area, Pie or Donut.
- Click Run. Click Download CSV to download the result.
Save a report
Section titled “Save a report”- Click Save.
- Fill in the Name and a description.
- Choose who can see it:
- Private — only you
- Public — visible to anyone with report builder access
- Click Save. When you change a report that’s already saved, the button reads Update.
Open a saved report
Section titled “Open a saved report”- Go to Reports → Custom → Saved Reports.
- Search by name or description, or filter by Scope (yours or shared with the organization).
- On a report’s row, use Run to run it, Edit to change it in Report Builder, or Delete to remove it.