Built-in reports
The Reports menu holds ready-made reports for sales, profit and loss, stock and regulated drugs. Every built-in report works the same way: pick filters, generate the report, then print it, export it or save a snapshot.
Available reports
Section titled “Available reports”All of them are under Reports → Built-In:
| Menu | What it shows |
|---|---|
| Revenue (Revenue Report) | Sales, fees, refunds, revenue, COGS and gross profit over time, by day, week or month. |
| Product P&L (Product Profit & Loss) | Quantity sold (in base units), sales, COGS, gross profit and margin per product, POS and invoice/B2B combined. |
| Outlet / Channel P&L | Profit and loss per outlet or per sales channel (By Outlet / By Channel). |
| Transactions (Transactions Report) | Sale volume and value, average basket and refund rate over time. |
| Sales Performance | A leaderboard of transactions, revenue and refund rate by cashier, outlet or channel. |
| Cashier Performance | Sales per cashier by day, week or month for the active outlet, against a sales target. |
| Batch Circulation | Each batch’s lifecycle: received, sold, remaining, expiry and turnover. |
| Stock Opname (Stock Opname Report) | Completed stock opname sessions: variance, accuracy and shrinkage value. |
| Stock Movement (Stock Movement Report) | The stock movement ledger and an in/out summary by type for a period. |
| Regulated Drugs | Monthly movement of narcotics, psychotropics, pharmaceutical precursors and OOT per product and batch, in the SIPNAP layout. |
Run a report
Section titled “Run a report”- Open a report from Reports → Built-In.
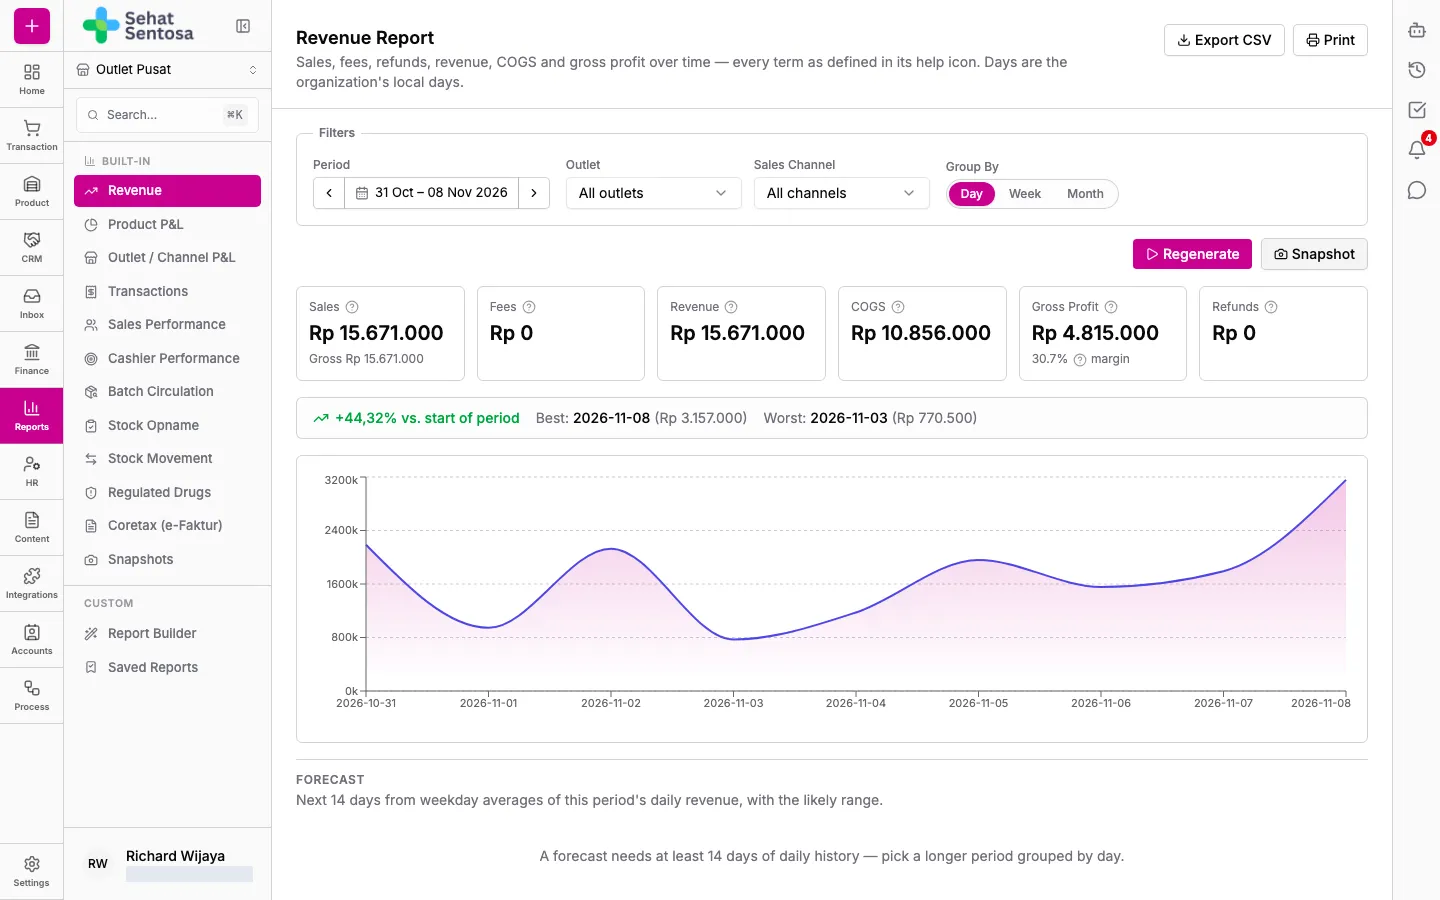
- In the Filters box, pick the Period and any other filters offered, such as outlet, channel or Group By.
- Click Generate. After changing a filter, click Regenerate to refresh the result.
Regulated Drugs filters by Month, outlet and drug Class. It can be exported, but has no print version, AI analysis or snapshot.
Print, export and analyse
Section titled “Print, export and analyse”- Print: opens a printable version of the report.
- Export CSV: downloads the report data as a CSV file you can open in Excel.
- AI Analysis: click Generate Insights for an AI-written summary of the report on screen.
Save a snapshot
Section titled “Save a snapshot”A snapshot is a report capture that can’t be changed. The numbers, charts and AI analysis are frozen when the snapshot is taken, which makes it useful for month-end archives or meetings.
- Generate the report as usual.
- Click Snapshot.
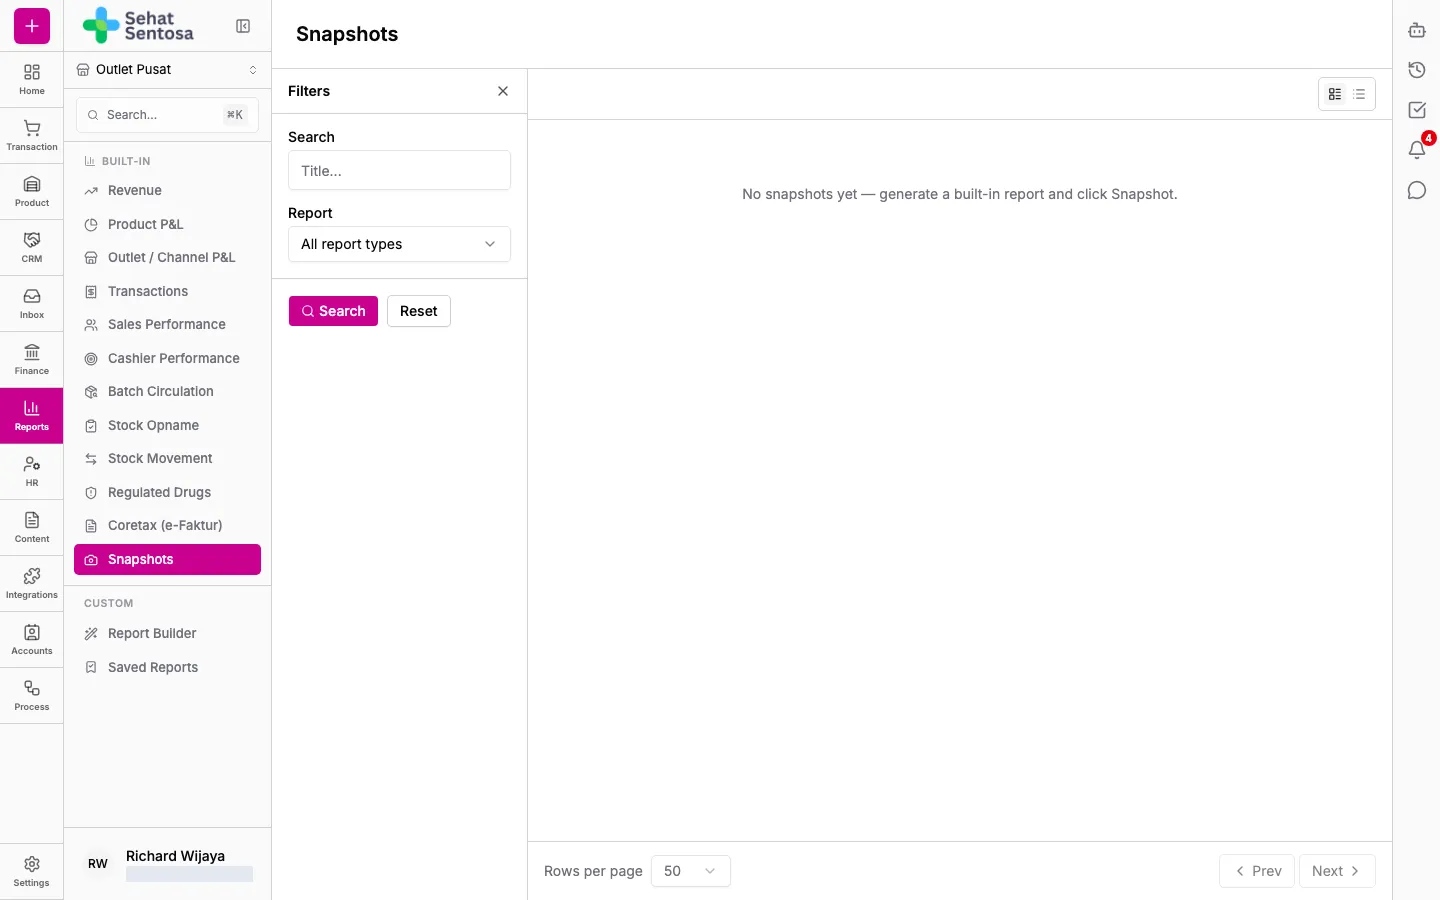
- Find all snapshots under Reports → Built-In → Snapshots. You can search by title or report type. Only the person who took a snapshot can rename or delete it.